
Copyright ©

D-35418 Buseck
1 Revision Index
|
Date |
Author |
Rev. |
Description |
|
2016-10-26 |
Hans Schmidts |
1.11 |
Don't use windings for lists etc. |
|
Ralf Dzionsko |
1.10 |
Editorial changes only |
|
|
2016-02-22 |
Ralf Dzionsko |
1.9 |
Extensive enhancements throughout the document to describe all features in detail; added lots of screenshots. |
|
2015-09-08 |
Hans Schmidts |
1.8 |
|
|
2013-03-19 |
A. Barth |
1.7 |
Update due to AIDA Tracer changes (display buffer handling, colour settings, import of log files etc.) |
|
2012-09-20 |
A. Barth |
1.6 |
New document structure and general update |
|
2012-09-13 |
A. Barth |
1.5 |
Screenshots updated to current Tracer / Stacker releases |
|
2007-01-11 |
U. v. Waldow |
1.4 |
- update due to change of stacker - stacks without filter allowed - support ‘silent’ mode for CAN stacks (no ACK) |
|
2004-01-15 |
U. v. Waldow |
1.3 |
modify description of build the buffer filename |
|
2003-04-02 |
U. v. Waldow |
1.2 |
Translation from ‘German’ into ‘English’ |
|
2003-03-20 |
U. v. Waldow |
1.1 |
First creation as printable document |
2 Table of Content
4.1.1 Exemplary Stack Components Configuration
4.1.1.2 Configure Stack Component
4.2.3.3 Reload
stacks/databases ![]()
4.2.4.3 Licensing Information …
4.2.4.4 AIDA System Settings …
4.3.1.2 Setting and Visualisation of filter rules
4.3.1.3 Monitoring of undefined messages
4.3.1.4 Advanced visualization hint (node icons and Tx group icons)
4.3.1.5 Advanced visualization hint (message icons)
4.3.1.6 Context menu for tree items
4.3.2 Trace Window (Message list)
4.3.2.4 Navigation in the message list
4.3.2.5 Context menu for list items
3 Introduction
The AIDA Tracer as independent application and as an addition to the AIDA Communicator displays and records all communications using AIDA stacks.
The AIDA Tracer is a receiver application, which listens to stack communication. All received objects can be interpreted by loadable object databases using the DBC format.
Using object databases containing message definitions you can choose the message objects, which will be displayed and saved to protocol files.
The protocol files are saved in a Microsoft Excel and Access compatible CSV format (comma separated value) or alternatively in a CANoe compatible ASC format.
Additionally it is possible to load CAN log files in ASC format for analysing the CAN data in offline mode.
4 Operating Manual
4.1 Basic Configuration
Basis of communication is a pre-configured communication stack in the form of a *.aida-cfg file, which must be built in advance using the AIDA Stacker. Therefore an example configuration using AIDA Stacker is shown here. Please read the AIDA Stacker manual for a more thorough description of the AIDA Stacker tool.
Using the stacker AIDA_Stacker.exe all communication components are arranged and configured.
In the following example a simple CAN communication (11bit identifier length, 100 kbps) will be built:
4.1.1 Exemplary Stack Components Configuration
4.1.1.1 Add Stack Components
Start AIDA_Stacker.exe and choose menu item Files – Create New Stack as shown in the following figure:

Figure 1: Create New Stack
AIDA stacks are built of communication layers - represented by stack components - ‘top-down’.
At first the higher (top) stack components (communication layers) are added, the last stack component represents the physical layer (here CAN).
The different stack components can be added by using the stack component manager.

Figure 2: Stack Manager
The AIDA Tracer typically requires a filter component Filter.component, which is added with the stack manager Add.
Note: If the stack is planned to be use without an object database (DBC file), the filter component is not required.

Figure 3: Add Component
Following file select box is opened after pressing the Add button.

Figure 4: Choose Filter Component
As next and last component add the CAN.component by pressing the Add button again and …

Figure 5: Add another Component
… select / open the requested CAN.component.

Figure 6: Add CAN Component
The directory can differ depending on the used CAN driver (e.g. “CAN_Vector” instead of “CAN_VXL”).
4.1.1.2 Configure Stack Component
Before we can use our new stack within AIDA Tracer, we first have to parameterize all the single stack components (apart from the filter component).
The default settings of the Filter component allow reception of all communication messages. (For detailed information concerning filter configuration, please reference to AIDA stacker and AIDA component descriptions.)
Note: The AIDA Tracer will use the filter configuration only if an object database (DBC file) is combined with this stack. In this case the filter component will be reprogrammed according to the assigned object database and the filter rules that are represented in the AIDA Tracer Tree Window (see Bus / Node Tree Window).
To configure the CAN component, select the CAN stack and press Configure:
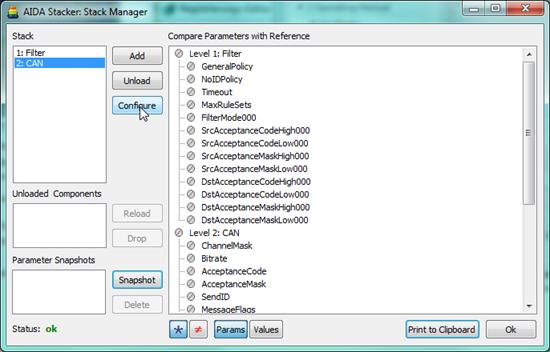
Figure 7: Stack Manager
The following window will be opened now:

Figure 8: CAN Component Parameterisation
Hint: To change the configuration settings of the CAN component, the component must be disconnected first by setting the ChannelMask to $0. This is the default setting of a newly added CAN component.
Now set stack parameter Bitrate to 100000.
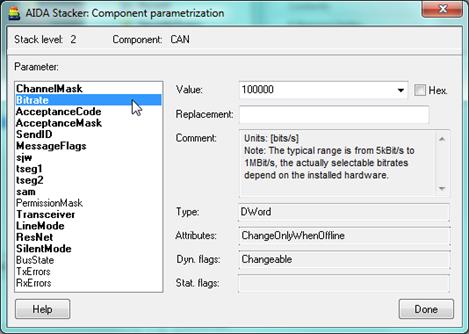
Figure 9: Set Bitrate
“11bit CAN identifier length” is set by parameters AcceptanceCode and AcceptanceMask equal $0 (please see comment in corresponding stack dialog).
The last step needs configuration of the ChannelMask corresponding to the chosen CAN driver and CAN bus. As soon as the channel mask is set to the right value, the stacker immediately shows possible communication data.

Figure 10: Setting Parameter ChannelMask
If the stack configuration is finished, please save the stack of our example using Files – Save Stack as... as file C:\test.aida-cfg.
4.1.2 Tracer Configuration
If the AIDA_Tracer.exe is started without parameter, a new unnamed project file is generated.
Under Project – Configure or with a ‘left-click’
on the tool button ![]() the configuration dialog is opened.
the configuration dialog is opened.
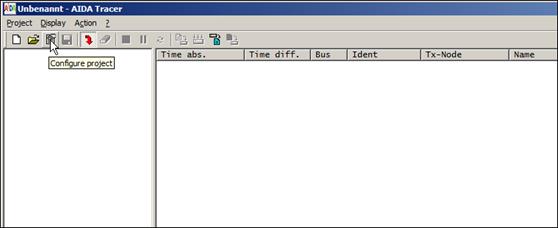
Figure 11: Open Tracer Configuration Dialog

Figure 12: Tracer Configuration Dialog Box
In our example the predefined communication stack test.aida-cfg is assigned to a logical bus number (the logical bus number does not necessarily map 1:1 to a real communication bus).

Figure 13: Tracer Configuration File Select Box

Figure 14: Tracer Configuration
If one (or more) corresponding object databases exist, they are entered under ‘Database(s)’.
Hint: Multiple selection of object databases is possible in the ‘Open’-dialog that can be accessed with the “…” button on the right. In this file selection dialog it is possible to select multiple files by holding the <Shift>-key (see above Figure 14, Database(s):).
If the CAN component should not generate acknowledge messages, please check mark no ACK (if applicable).
A maximum of four logical different (or equal) communication buses can be assigned, which are displayed in a message list simultaneously.
4.1.3 Start Tracing
If configuration is successfully done, Action
– Trace or tool button Trace
On/Off ![]() /
/![]() alternately
activates and deactivates communication tracing.
alternately
activates and deactivates communication tracing.
If one or more object databases are successfully loaded, the different nodes are visualised on the left side of the tracer window (bus/node window).
Within the ‘message tree’ (left view) the checkboxes represent filter rules, which are saved in tracer configuration files *.tracer-cfg.
The received messages can be seen on the right part of the window (Trace window).
4.2 Tracer Menus
4.2.1 Project
Here you can create and configure a new project (“tracer configuration”) or open an existing project.
This menu also contains a list of the recent projects so they can be accessed quickly.
4.2.1.1
New 
Creates a new unnamed project file, which must be configured afterwards. All existing configuration changes will be lost, if not saved when asked. The message list will be cleared also.
4.2.1.2
Open 
Opens the file dialog box to select and load an existing AIDA Tracer project.
The default file extension for AIDA Tracer projects is the native AIDA Tracer format (*.tracer-cfg). In a future version an XML format (*.xml) might be supported also.
If the AIDA stack configuration is not valid (e.g. if no CAN hardware / driver is present), the AIDA Tracer is switched to “offline mode”. So it is possible to load and analyse a CAN log file without changing the AIDA Tracer project configuration.
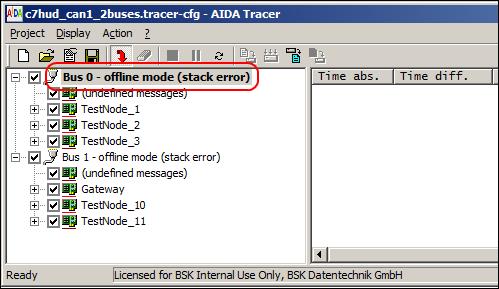
Figure 15: Tracer Offline Mode
Loading a configuration will clear any monitored message in the message list.
It is also possible to force the offline mode. This can be done by pressing the <Shift>-key while the configuration is loaded. This feature can be useful when the stack cannot be loaded anyway (*) and only the database configuration is needed, e.g. for analysis purposes.
(*) The stack configuration might depend on the currently connected HW devices, such as a CAN box or the stack configuration is not “resolvable” because it is a remote stack configuration and the remote server is offline. Trying to load such a stack configuration will block until a timeout is detected which may take a significant time.
4.2.1.3
Configure 
Opens the following AIDA Tracer configuration dialog:

Figure 16: Description of AIDA Tracer Configuration Dialog Box
![]() Up to 4 independent buses are possible.
(Note: It is possible to assign the same physical channel to more than one
logical bus.)
Up to 4 independent buses are possible.
(Note: It is possible to assign the same physical channel to more than one
logical bus.)
![]() Opens the file dialog box to choose the
AIDA stack configuration for the selected bus (*.aida-cfg).
Opens the file dialog box to choose the
AIDA stack configuration for the selected bus (*.aida-cfg).
![]() Opens the file dialog box to choose and
assign the object database (e.g. CAN DBC) for this bus. Multiple selections of
object databases are possible (see also Example in Figure 14: Tracer
Configuration).
Opens the file dialog box to choose and
assign the object database (e.g. CAN DBC) for this bus. Multiple selections of
object databases are possible (see also Example in Figure 14: Tracer
Configuration).
![]() This parameter controls the
generation of acknowledges on the CAN bus. Normally every node connected to the
CAN bus generates ACK signals. The AIDA stacks can also generate these ACK
signals. But they can also be suppressed by selecting this checkbox (if the
used CAN hardware and driver is supporting this feature).
This parameter controls the
generation of acknowledges on the CAN bus. Normally every node connected to the
CAN bus generates ACK signals. The AIDA stacks can also generate these ACK
signals. But they can also be suppressed by selecting this checkbox (if the
used CAN hardware and driver is supporting this feature).
The “Cancel”-button will undo any changes that have been done in this dialog. The dialog will be closed without any further action.
Pressing the “OK”-button will close the dialog and apply all changes immediately (reload stack and/or database configuration). The message list will be cleared also.
As described in Open ![]() it is
possible to suppress the loading of the stack configuration(s) by pressing the
<Shift>-key together with the “OK”-button. This enforces the “offline
mode” for all configured buses.
it is
possible to suppress the loading of the stack configuration(s) by pressing the
<Shift>-key together with the “OK”-button. This enforces the “offline
mode” for all configured buses.
4.2.1.4
Save 
Saves the current AIDA Tracer configuration to disk. If a new “unnamed” project was created and shall be stored the first time, a file dialog box is opened to choose the filename (incl. directory).
In addition to the parameters from Figure 16, the current scroll mode, column width, sort sequence (for the messages in fixed position mode), the assignment of colours and filter settings for the node/messages/signals and the window position are stored in the configuration file.
When the project already exists then the AIDA Tracer will create a backup file (*.bak) of the project file before saving the new version.
4.2.1.5 Save as …
Opens the file selector dialog window. Choose an existing directory and type a filename to save the current AIDA Tracer configuration with a new name.
4.2.2 Display
The display mode for the messages, the used font and the availability of the status and symbol bar can be configured here. The message list can be cleared also.
4.2.2.1
Scroll View  /
/ 
Switches the display mode of the monitoring output. Messages can be shown at a fixed position or, when using scroll mode, in chronological order. The current setting is stored in the configuration file.
4.2.2.2
Clear 
Clears the message window (message list).
4.2.2.3 Symbol Bar
The symbol bar can be switched on or off.
Following actions can be accessed directly (from left to right): New ![]() , Open
, Open ![]() , Configure
, Configure ![]() , Save
, Save ![]() , Scroll View
, Scroll View ![]() /
/![]() , Clear
, Clear ![]() , Trace
, Trace ![]() /
/![]() , Pause
, Pause ![]() , Reload stacks/databases
, Reload stacks/databases
![]() , Save Buffer
, Save Buffer ![]() , Protocol
, Protocol ![]() , Load ASCII Trace
, Load ASCII Trace ![]() , Save ASCII Trace
, Save ASCII Trace ![]() .
.
A text with a short description (tooltip) is shown when you hover over a symbol. Additionally a more detailed description can be seen in the status bar at the bottom of the AIDA Tracer window.
The display status of the symbol bar (shown or hidden) is stored in the Windows Registry as global setting for the AIDA Tracer.
4.2.2.4 Status Bar
The status bar, located at the bottom of
the AIDA Tracer window, can be switched on or off. It shows some general status
messages or hints on the left side (![]() ) of the AIDA Tracer window. On the right-hand
miscellaneous information is visualised. Possible error messages of the used
object database, separated with colons per bus, are listed here
) of the AIDA Tracer window. On the right-hand
miscellaneous information is visualised. Possible error messages of the used
object database, separated with colons per bus, are listed here ![]() . Information about
received, displayed and - in pause mode - internally queued messages (
. Information about
received, displayed and - in pause mode - internally queued messages (![]() ) as well as the
current selected line (
) as well as the
current selected line (![]() ) in the Tracer Window are displayed, too. In
the middle-left pane also various information is visualised, such as license
information (
) in the Tracer Window are displayed, too. In
the middle-left pane also various information is visualised, such as license
information (![]() )
or status information about reading or writing log-files.
)
or status information about reading or writing log-files.
|
|
… |
|
||
|
|
||||
|
|
||||
|
… |
|
… |
||

Figure 17: Status Bar
The display status of the status bar (shown or hidden) is stored in the Windows Registry as global setting for the AIDA Tracer.
4.2.2.5 Set Font
The font which is used to visualise the received messages can be chosen by the user.
The default font provided by Windows is usually a proportional font. Because the representation of the messages should not be uncomfortable to look at, it is highly recommended to use a monospace font like Lucida Console instead.
The font setting is stored in the Windows Registry as global setting for the AIDA Tracer.
4.2.2.6 Reset to Default Font
Resets the current font setting and uses the Windows default font again.
4.2.3 Action
Start and stop of the monitoring incl. handling of the protocol file can be done here. Also, reloading of the stacks and databases is possible.
4.2.3.1
Trace  /
/ 
Toggles communication tracing for all
configured buses. When the tracing is started (![]() ) and the configurations have been
setup correctly and one or more buses are active, messages can be seen on the
right part of the AIDA Tracer window now.
) and the configurations have been
setup correctly and one or more buses are active, messages can be seen on the
right part of the AIDA Tracer window now.
4.2.3.2
Pause 
Pauses the output of trace window, so no display update will happen.
The tracing of messages continues in the background. When “Pause” is deselected then the display is updated again.
4.2.3.3 Reload stacks/databases 
Reloads the configured AIDA stacks and databases, thereby preserving the current settings, i.e. the expansion status, the configured colours and the filter rules (= checkbox states).
The message list will be cleared.
As described in Open ![]() it is
possible to suppress the loading of the stack configuration(s) by pressing the
<Shift>-key together with the “OK”-button. This enforces the “offline
mode” for all configured buses.
it is
possible to suppress the loading of the stack configuration(s) by pressing the
<Shift>-key together with the “OK”-button. This enforces the “offline
mode” for all configured buses.
4.2.3.4
Save Buffer 
Saves the currently displayed message list.
This action is only possible during Pause ![]() or if the communication
is stopped (Trace
or if the communication
is stopped (Trace ![]() /
/ ![]() ). The filename is
built by current date, time and scroll mode e.g.: tracer_20160209T134927_fixed.csv.
). The filename is
built by current date, time and scroll mode e.g.: tracer_20160209T134927_fixed.csv.
All messages are stored in CSV format. In the file dialog box it is possible to select whether the signals should be included additionally to the CAN messages or not.
The selection (CSV with or without signals) is stored in the Windows Registry as global setting for the AIDA Tracer.
A Windows message box with the filename and full path is shown when the triggered action is finished successfully.
4.2.3.5
Protocol 
Toggles start / stop of the logging to a file which is saved in the background during normal operation. When starting the protocol, a file selector dialog window is opened. Choose an existing directory and type a filename.
Additionally the output format must be specified: Microsoft Excel compatible CSV format (comma separated value) or a CANoe compatible ASC format. In case of ASC, an offset of 1 is added to the AIDA Tracer bus number, e.g. the bus 0 is mapped to CANoe channel 1.
The chosen output format is stored in the Windows Registry as global setting for the AIDA Tracer.
4.2.3.6
Load ASCII Trace 
Loads a log file with a CANoe compatible ASC format for analysing CAN data.
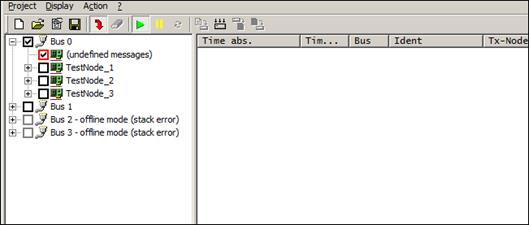
An existing Tracer Configuration is not mandatory, so one can use this “offline mode” without any AIDA stack configuration and database.
In this case the imported messages will be added as child items below the node “(undefined messages)” in the message tree provided that the bus number of those messages is between 0 and 3:
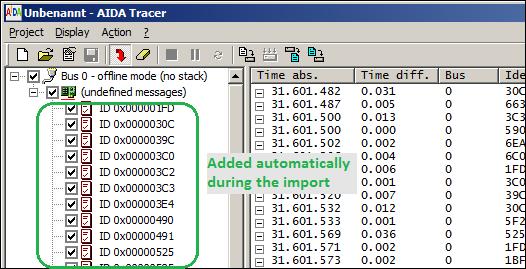
Figure 18: Import of ASC File – Add undefined messages to tree
The term “undefined” refers to the fact that these messages could not be found in the database configuration (because there is none configured).
The added messages in the tree are helpful to support the analysis because it is possible to search those messages in the Trace window (this is described later in Context menu for tree items and Context menu for list items) and colorize them individually. It is also possible to deselect the messages that are not interesting and then redo the log file import, this time with applied filter rules as described some paragraphs below.
These undefined messages are only available
in the tree as long as the stack and/or database configuration is not changed.
That means that those items will be removed as soon as the configuration of the
stack(s) and or database(s) is changed (see Configure ![]() ) or a new AIDA
Tracer configuration is created (New
) or a new AIDA
Tracer configuration is created (New ![]() )
or loaded (Open
)
or loaded (Open ![]() ). They cannot be
stored in the Tracer configuration file, either. As described in Context menu for tree items the undefined messages can be removed manually from the tree using
the appropriate menu item from the context menu, provided that the messages are
not (longer) contained in the Trace window.
). They cannot be
stored in the Tracer configuration file, either. As described in Context menu for tree items the undefined messages can be removed manually from the tree using
the appropriate menu item from the context menu, provided that the messages are
not (longer) contained in the Trace window.
Usually 4
independent buses can be configured by the AIDA Tracer (see Configure ![]() ). As described
above, undefined messages are added in the tree view on the left when the bus
number is between 0 and 3 (and the messages cannot be assigned to a definition
in the database or no database is configured at all). But AIDA Tracer is also able
to visualise messages from buses with numbers greater than 3 in the Trace
window when they are imported from the log file. These lines are always displayed
in grey text colour (
). As described
above, undefined messages are added in the tree view on the left when the bus
number is between 0 and 3 (and the messages cannot be assigned to a definition
in the database or no database is configured at all). But AIDA Tracer is also able
to visualise messages from buses with numbers greater than 3 in the Trace
window when they are imported from the log file. These lines are always displayed
in grey text colour (![]() ) in the Trace window, but those messages do NOT
appear in the tree view (
) in the Trace window, but those messages do NOT
appear in the tree view (![]() ).
).

Figure 19: Visualisation of Bus Numbers > 3 in Offline Mode
Please note that the method of bus counting is different between AIDA Tracer (range 0 … 3) and the channel information included in the ASC file (range 1 ..32). So you have to consider an offset of 1.
Also AIDA Tracer is able to import ASC
files which include symbolic message names instead of CAN identifiers. In the
following example the CAN ID is visualised as <?> (![]() ) and the symbolic names
are listed in brackets (
) and the symbolic names
are listed in brackets (![]() ).
).
In the tree
view the symbolic name will be shown (![]() ).
).
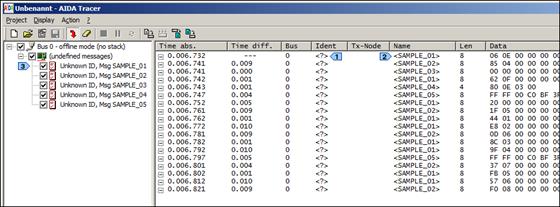
Figure 20: Import of ASC File with Symbolic Names instead of CAN IDs
If an object database is specified for the current the AIDA Tracer configuration (or some “undefined messages” are available in the tree from a previous import), it is possible to use the configured filter rules for the CAN messages, nodes and buses during the import. In this case a message box appears that asks whether the configured filter rules shall be applied or not:
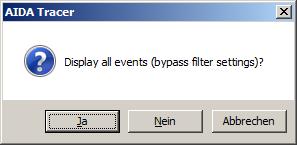
Figure 21: Import of ASC File – Select import mode
Selecting “yes” will import everything from the log file whereas “no” will apply the current filter rules during the import.
Note: Even when a database configuration exists it is possible that the imported trace file contains undefined messages, so they are added to the tree as described above.
The internal display buffer is limited to a maximum of 2 million lines depending on the available memory size (built-in RAM). So the import of the message data is aborted with a warning when this limit will be exceeded. This is a limit concerning the visualisation buffer and means that the ASC file may well contain more than 2 million lines if some Tracer filter rules concerning messages / buses are applied.
4.2.3.7
Save ASCII Trace 
Saves the current display buffer (always from the scroll view!) into a log file using a CANoe compatible ASCII format.
If an object database (DBC) for the CAN messages is configured, the symbolic message names are appended as comment at the end of every line. This information is useful when importing such a file without any configured DBC. Example:
|
date Thu Feb 11 15:53:19 2016 base hex timestamps absolute internal events logged // Exported by AIDA Tracer 7.00.005. Channel number exported with +1 offset // Bus 0 (channel 1): Stack=Test.aida-cfg (2016-02-10 15:41), DBC=Sample_1.dbc (2016-02-10 19:03) // Bus 1 (channel 2): Stack=Test.aida-cfg (2016-02-10 15:41), DBC=Sample_2.dbc (2013-02-21 16:51) 24998.69900 2 649 Rx d 8 00 80 00 00 00 00 00 00 // Msg=SAMPLE_04 24999.97000 1 30C Rx d 8 D7 E0 3F 01 00 00 06 00 // Msg=SAMPLE_02 24999.97000 2 30C Rx d 8 D7 E0 3F 01 00 00 06 00 // Msg=SAMPLE_02 25000.02700 1 30C Rx d 8 AC 81 01 25 00 00 06 00 // Msg=SAMPLE_02 |
Figure 22: Excerpt from saved ASCII Trace File
This is how it looks when this trace is re-imported into a new AIDA Tracer project (without configuration for stacks and databases):

Figure 23: Imported ASCII Trace File (no DBC available)
4.2.4 ?
Gives some help and additional info like AIDA Tracer Revision …
4.2.4.1 Help
Opens this documentation (HTML format) in the default web browser.
4.2.4.2 Info about Tracer …
Shows information about the current used AIDA Package Version and the AIDA Tracer Revision.
4.2.4.3 Licensing Information …
Shows detailed information about the licensed AIDA Version, Windows Applications, PI modules, Stack Components and Plugins.
4.2.4.4 AIDA System Settings …
Starts the AIDA System Settings Wizard to change some of the current system settings.
4.3 Tracer Window
The AIDA Tracer window is divided into 2 sections. Left-hand the buses with all the nodes and messages can be seen in a tree view. Right hand the monitored messages are visualised.
The representation is depending on using an object database or not. If one (or more) object database(s) are successfully loaded, the database contents are used to:
• represent and organize communication node and message hierarchy
• interpret the signals coded in each message
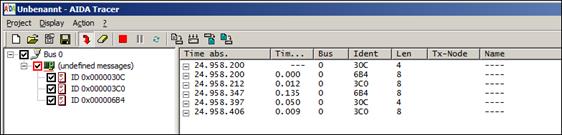
Figure 24: Representation without Object Database
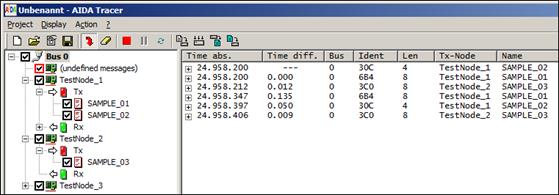
Figure 25: Representation with Object Database
4.3.1 Bus / Node Tree Window
4.3.1.1 Overview
The tree view consisting of the buses, nodes and messages is shown on the left hand. Within this tree the checkboxes represent filter rules for the messages that will be visualised on the right part of the AIDA Tracer window. The filter rules (status of the checkboxes) and expansion status of the bus and node items are saved in tracer configuration files *.tracer-cfg.
Hint: User changes on filter rules and expansion status must be saved manually per Project – Save to the tracer configuration file. A warning to store the configuration is only given after basic configuration changes (stack configuration, database configuration) and after changing the colour settings.
The
following figure shows the different filter options. It is possible to filter
all messages from one bus (see ![]() ), specific nodes (see
), specific nodes (see ![]() ) or transmitted (
) or transmitted (![]() ) and received messages
(
) and received messages
(![]() ) by using
the different checkboxes.
) by using
the different checkboxes.
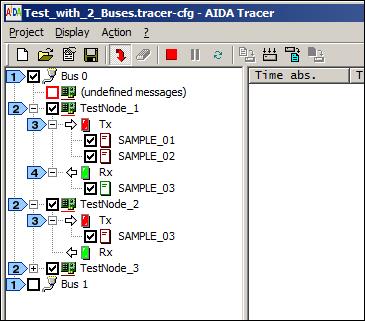
Figure 26: Tree View - Buses, Nodes and Messages
If a node
exists with many Tx messages and the filter should be opened only for one
message, it is very annoying to deselect all checkboxes except for this one. In
this case, you should right-click with the mouse onto the dedicated node (![]() ). This opens a
context menu to disable (or enable) all messages which are transmitted by this
node.
). This opens a
context menu to disable (or enable) all messages which are transmitted by this
node.
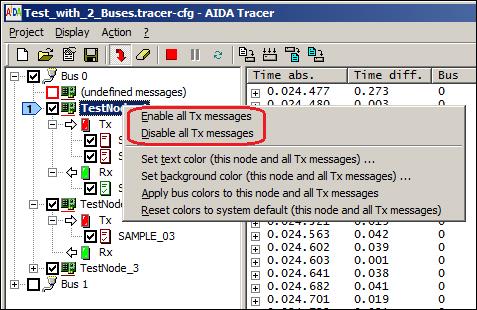
Figure 27: Enable/Disable all Tx messages of a Node
To visualisation in the message window can
be enhanced by configuring colours for the different buses (1), nodes (2) and
messages (3)+(4), see the screenshots below. The text- and background colours are
configurable for each tree item of type “bus”, “node” and “message”.
Additionally the colours of the “parent item” can be applied or the values can
be restored again to the system default settings. The context menu with the
setting options will open by right-click with the mouse onto the selected item
(![]() )..
)..
|
(1)
|
(2)
|
|
(3)
|
(4)
|
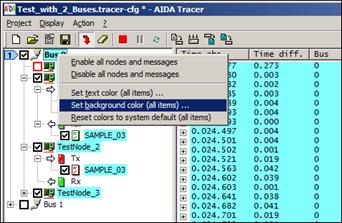


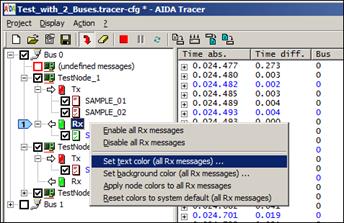
Figure 28: Colour Marking of Bus, Node, Tx-Message and Rx-Message
Selecting any of those menu items opens the standard Windows Colour Picker dialog:
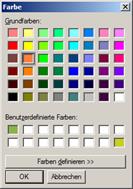
Figure 29: Standard Windows Colour Picker dialog
The selected colour will be applied when the dialog is closed by clicking the “OK”-button.
The colour settings are stored in the AIDA Tracer configuration file.
Hint: The
colour settings (and also the message filter settings and the expansion status
of the tree items) will be reset to default when the DBC configuration is
changed using the configuration dialog (Configure ![]() ).
).
The Windows Colour Picker dialog allows to customize up to 16 colours. These customizable colours will be stored in the Windows Registry as global setting for the AIDA Tracer.
4.3.1.2 Setting and Visualisation of filter rules
Filter rules can be set for buses, nodes and messages. The filter rules are visualised by checkboxes. The user interface allows to “check” or “uncheck” the filter rule for those items explicitly.
But the condition whether a filter rule applies does not only depend on the item itself, but also on its parent(s) and the status of the underlying stack. Therefore, the checkmark of the checkbox together with the colour of the checkbox determine the current filter status.
In general, when the border of a checkbox
is grey (![]() ,
, ![]() ,
, ![]() ), then the underlying
stack is “offline” or there is no stack configured at all. The only way to
bring the stack in the “online” state is to load or reload it with either of
the commands Open
), then the underlying
stack is “offline” or there is no stack configured at all. The only way to
bring the stack in the “online” state is to load or reload it with either of
the commands Open ![]() , Configure
, Configure ![]() or Reload stacks/databases
or Reload stacks/databases ![]() .
.
Buses are located at the root level of the
tree, the associated icon on the right side of the checkbox is ![]() .
.
The checkbox for the buses can have the following states:
• ![]() - the bus is “online” (the AIDA stack
for the bus is online), but turned off by the filter rule (the communication for
this bus is suppressed, because the checkbox is unchecked). See Bus 0 in
the example below.
- the bus is “online” (the AIDA stack
for the bus is online), but turned off by the filter rule (the communication for
this bus is suppressed, because the checkbox is unchecked). See Bus 0 in
the example below.
• ![]() - the bus is “online” (the AIDA stack
for the bus is online) and turned on (the communication can be monitored). See Bus
1 in the example below.
- the bus is “online” (the AIDA stack
for the bus is online) and turned on (the communication can be monitored). See Bus
1 in the example below.
• ![]() - the bus is “offline” (the AIDA
stack for the bus is offline), no communication is possible. The bus is turned
off by the filter rule (the check mark is unchecked). See Bus 2 in the
example below.
- the bus is “offline” (the AIDA
stack for the bus is offline), no communication is possible. The bus is turned
off by the filter rule (the check mark is unchecked). See Bus 2 in the
example below.
• ![]() -
the bus is “offline” (the AIDA stack for the bus is offline), no communication
is possible. The bus is turned on by the filter rule (the check mark is set),
but implicitly deactivated because the stack is offline. See Bus 3 in
the example below.
-
the bus is “offline” (the AIDA stack for the bus is offline), no communication
is possible. The bus is turned on by the filter rule (the check mark is set),
but implicitly deactivated because the stack is offline. See Bus 3 in
the example below.
Example:

Figure 30: Filter rules for buses
In the hierarchy below buses are the
“nodes” (ECU). In the tree, nodes are child items of the buses. The associated
icon on the right side of the checkbox is ![]() .
.
The checkbox for the nodes can have the following states:
• ![]() - the parent bus is “online”, but the
node is turned off by the filter rule (the communication is suppressed, because
the checkbox is unchecked). The filter rule of the parent bus doesn’t matter
here. See Bus0.TestNode_2 and Bus1.TestNode_10 in the example
below.
- the parent bus is “online”, but the
node is turned off by the filter rule (the communication is suppressed, because
the checkbox is unchecked). The filter rule of the parent bus doesn’t matter
here. See Bus0.TestNode_2 and Bus1.TestNode_10 in the example
below.
• ![]() - the parent bus is “online” and
turned on and the node is turned on (the communication of all messages that are
transmitted by this node can be monitored). See Bus1.Gateway and Bus1.TestNode_11
in the example below.
- the parent bus is “online” and
turned on and the node is turned on (the communication of all messages that are
transmitted by this node can be monitored). See Bus1.Gateway and Bus1.TestNode_11
in the example below.
• ![]() - the parent bus is “online”, but
turned off (checkbox unchecked). The node is turned on by the filter rule (the
check mark is set), but implicitly deactivated by the parent state. Therefore
no communication for the messages transmitted by this node is possible and the
check mark is grey. See Bus0.TestNode_1 and Bus0.TestNode_3 in
the example below.
- the parent bus is “online”, but
turned off (checkbox unchecked). The node is turned on by the filter rule (the
check mark is set), but implicitly deactivated by the parent state. Therefore
no communication for the messages transmitted by this node is possible and the
check mark is grey. See Bus0.TestNode_1 and Bus0.TestNode_3 in
the example below.
• ![]() - the parent bus is “offline”, no
communication is possible. The node is turned off by the filter rule (checkbox
unchecked). The filter rule of the parent bus doesn’t matter here. See Bus2.TestNode_2,
Bus2.TestNode_3 and Bus3.TestNode_11 in the example below.
- the parent bus is “offline”, no
communication is possible. The node is turned off by the filter rule (checkbox
unchecked). The filter rule of the parent bus doesn’t matter here. See Bus2.TestNode_2,
Bus2.TestNode_3 and Bus3.TestNode_11 in the example below.
• ![]() - the parent bus is “offline”, no communication
is possible. The node is turned on by the filter rule (the check mark is set).
The check mark is black because the parent bus is turned on, too. See Bus3.Gateway
and Bus3.TestNode_10 in the example below.
- the parent bus is “offline”, no communication
is possible. The node is turned on by the filter rule (the check mark is set).
The check mark is black because the parent bus is turned on, too. See Bus3.Gateway
and Bus3.TestNode_10 in the example below.
• ![]() - the parent bus is “offline” and turned
off (the checkbox of the parent is unchecked), no communication is possible.
The node is turned on by the filter rule (the check mark is set), but
implicitly deactivated by the parent state (therefore the check mark is grey).
See Bus2.TestNode_1 in the example below.
- the parent bus is “offline” and turned
off (the checkbox of the parent is unchecked), no communication is possible.
The node is turned on by the filter rule (the check mark is set), but
implicitly deactivated by the parent state (therefore the check mark is grey).
See Bus2.TestNode_1 in the example below.
Example:
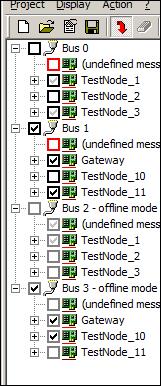
Figure 31: Filter rules for nodes
Nodes can have messages assigned. The
assigned messages for a node are grouped as “Tx”-messages and as “Rx”-messages.
This is visualised by the additional tree level between nodes and messages with
the icons ![]() (parent
for the Tx-messages) and
(parent
for the Tx-messages) and ![]() (parent for the Rx-messages).
(parent for the Rx-messages).
The Tx-messages are transmitted by the node,
their icon is ![]() .
Rx-messages are received by the node, their icon is
.
Rx-messages are received by the node, their icon is ![]() . A message can be transmitted only
by one node for a given bus, but several nodes may receive the same message.
Therefore, a message can appear in the tree at various locations: As a
Tx-message of a certain node and as a Rx-message of several other nodes.
. A message can be transmitted only
by one node for a given bus, but several nodes may receive the same message.
Therefore, a message can appear in the tree at various locations: As a
Tx-message of a certain node and as a Rx-message of several other nodes.
The configuration (filter rule, colour) for the message can be done at either location in the tree, but it always applies to all instances, because all instances represent the same message object.
Example:
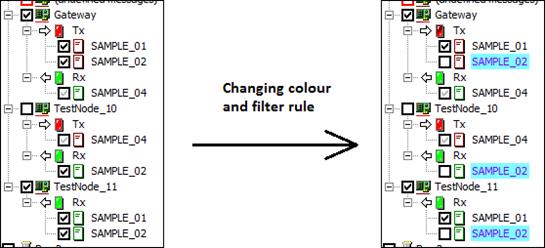
Figure 32: Assignment of Tx-messages and Rx-messages to nodes
The checkbox for the messages can have the following states:
• ![]() - the parent bus is “online”, but the
message is turned off by the filter rule (the communication is suppressed,
because the checkbox is unchecked). The filter rule of the parent bus and
parent node (that owns the message as Tx-message) doesn’t matter here. See Bus0.TestNode_1.SAMPLE_01,
Bus0.TestNode_2.SAMPLE_03 and Bus1.Gateway.SAMPLE_01 in the
example below (left side).
- the parent bus is “online”, but the
message is turned off by the filter rule (the communication is suppressed,
because the checkbox is unchecked). The filter rule of the parent bus and
parent node (that owns the message as Tx-message) doesn’t matter here. See Bus0.TestNode_1.SAMPLE_01,
Bus0.TestNode_2.SAMPLE_03 and Bus1.Gateway.SAMPLE_01 in the
example below (left side).
• ![]() - the parent bus is “online” and
turned on, the parent node (that owns the message as Tx-message) is turned on
and the message is turned on. The communication of the message can be
monitored. See Bus1.Gateway.SAMPLE_02 and Bus1.TestNode_10.SAMPLE_02
in the example below (left side).
- the parent bus is “online” and
turned on, the parent node (that owns the message as Tx-message) is turned on
and the message is turned on. The communication of the message can be
monitored. See Bus1.Gateway.SAMPLE_02 and Bus1.TestNode_10.SAMPLE_02
in the example below (left side).
• ![]() - the parent bus is “online”, but the
bus is turned off and/or the parent node (that owns the message as Tx-message)
is turned off (checkbox unchecked). The message is turned on by the filter rule
(the check mark is set), but implicitly deactivated by the parent state.
Therefore no communication is possible and the check mark is grey. See Bus0.TestNode_1.SAMPLE_02,
Bus1.Gateway.SAMPLE_04 and Bus1.TestNode_10.SAMPLE_04 in the
example below (left side).
- the parent bus is “online”, but the
bus is turned off and/or the parent node (that owns the message as Tx-message)
is turned off (checkbox unchecked). The message is turned on by the filter rule
(the check mark is set), but implicitly deactivated by the parent state.
Therefore no communication is possible and the check mark is grey. See Bus0.TestNode_1.SAMPLE_02,
Bus1.Gateway.SAMPLE_04 and Bus1.TestNode_10.SAMPLE_04 in the
example below (left side).
• ![]() - the parent bus is “offline”, no
communication is possible. The message is turned off by the filter rule
(checkbox unchecked). The filter rule of the parent bus and parent node (that
owns the message as Tx-message) doesn’t matter here. See Bus0.TestNode_1.SAMPLE_01,
Bus0.TestNode_2.SAMPLE_03 and Bus1.Gateway.SAMPLE_01 in the
example below (right side).
- the parent bus is “offline”, no
communication is possible. The message is turned off by the filter rule
(checkbox unchecked). The filter rule of the parent bus and parent node (that
owns the message as Tx-message) doesn’t matter here. See Bus0.TestNode_1.SAMPLE_01,
Bus0.TestNode_2.SAMPLE_03 and Bus1.Gateway.SAMPLE_01 in the
example below (right side).
• ![]() - the parent bus is “offline”, no
communication is possible. The message is turned on by the filter rule (the
check mark is set). The check mark is black, because both the parent bus and
the node (that owns the message as Tx-message) are turned on, too. See Bus1.Gateway.SAMPLE_02
and Bus1.TestNode_10.SAMPLE_02 in the example below (right side).
- the parent bus is “offline”, no
communication is possible. The message is turned on by the filter rule (the
check mark is set). The check mark is black, because both the parent bus and
the node (that owns the message as Tx-message) are turned on, too. See Bus1.Gateway.SAMPLE_02
and Bus1.TestNode_10.SAMPLE_02 in the example below (right side).
• ![]() - the parent bus is “offline” and
turned off, no communication is possible. The bus is turned off and/or the
parent node (that owns the message as Tx-message) is turned off (checkbox
unchecked). The message is turned on by the filter rule (the check mark is
set), but implicitly deactivated by the parent state (therefore the check mark
is grey). See Bus0.TestNode_1.SAMPLE_02, Bus1.Gateway.SAMPLE_04
and Bus1.TestNode_10.SAMPLE_04 in the example below (right side).
- the parent bus is “offline” and
turned off, no communication is possible. The bus is turned off and/or the
parent node (that owns the message as Tx-message) is turned off (checkbox
unchecked). The message is turned on by the filter rule (the check mark is
set), but implicitly deactivated by the parent state (therefore the check mark
is grey). See Bus0.TestNode_1.SAMPLE_02, Bus1.Gateway.SAMPLE_04
and Bus1.TestNode_10.SAMPLE_04 in the example below (right side).
Example:
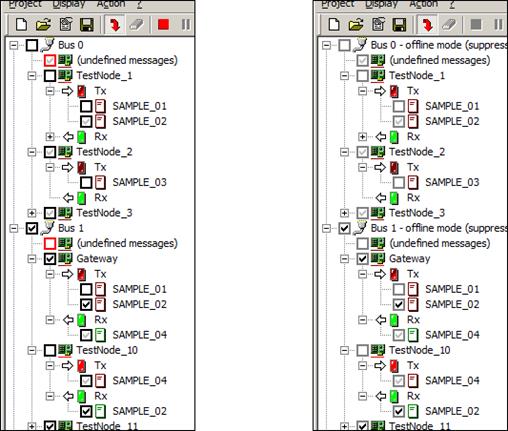
Figure 33: Filter rules for messages (left side - stack online, right side - stack offline)
4.3.1.3 Monitoring of undefined messages
Each bus has an artificial node called “(undefined messages)”. This node has a red checkbox assigned (when the bus is online) to emphasize its special meaning. When the bus is offline the checkbox will be grey (similar as for ordinary nodes).
When the checkbox for this node is checked then the AIDA Tracer can monitor messages that aren’t assigned in the database configuration. This covers messages for existing nodes or messages of new nodes that weren’t available at the time when the database was created.
When such a message is received then it will be written to the Trace window and additionally a child item for that message will be created below the special node:
(→ after receiving some undefined messages:)
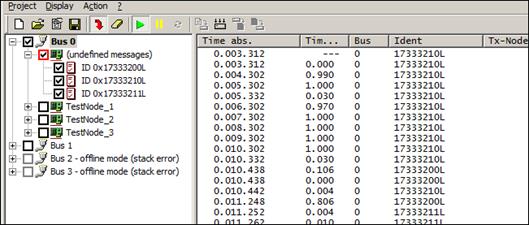
Figure 34: Receiving messages that aren’t defined in the database
The special node will appear also in the case when no database is configured at all as soon as any message has been received:

(→ after receiving some undefined messages:)
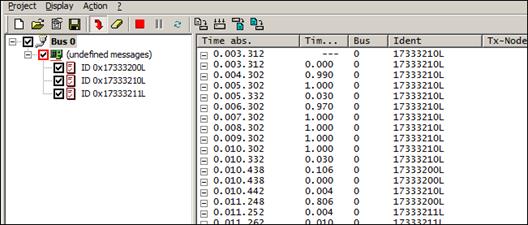
Figure 35: Receiving messages when no database is configured
As soon as the undefined messages appear in the tree, it is possible to apply the usual settings (filter rules and foreground/background colour):

Figure 36: Applying settings to undefined messages
But in contrast to the messages that are defined in the database, the settings for the undefined messages (and their appearance in the tree) cannot be stored. They will get lost as soon as the configuration is changed.
The AIDA Tracer can also monitor special messages or events generated by the AIDA stack, e.g. “error frame messages”. These events will also appear below the special node:
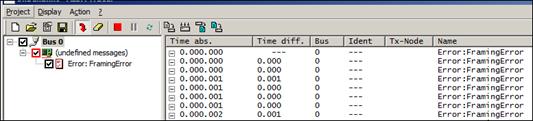
Figure 37: Monitoring of AIDA events
4.3.1.4 Advanced visualization hint (node icons and Tx group icons)
The node icon exists in three variations (note the colour of the red line at the bottom of the icon):
• ![]() - all Tx messages that are assigned to that node are turned on.
- all Tx messages that are assigned to that node are turned on.
• ![]() - at least one of the Tx messages (but not
all) that are assigned to that node are turned on.
- at least one of the Tx messages (but not
all) that are assigned to that node are turned on.
• ![]() - all Tx messages that are assigned to that node are turned off
- all Tx messages that are assigned to that node are turned off
A similar variation exists for the grouping icon for the Tx messages:
• ![]() - all Tx messages that are assigned to that node are turned on.
- all Tx messages that are assigned to that node are turned on.
• ![]() - at least one of the Tx messages (but not
all) that are assigned to that node are turned on.
- at least one of the Tx messages (but not
all) that are assigned to that node are turned on.
• ![]() - all Tx messages that are assigned to
that node are turned off
- all Tx messages that are assigned to
that node are turned off
This is helpful to roughly recognize the filter rules of the Tx messages of a node even if the nodes are collapsed in the tree.
Example:
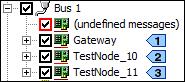
Figure 38: Node icon depending on filter rules of the assigned Tx messages (1)
Here, all nodes are collapsed, but we can
conclude that for the node Test_Node_10 all messages are turned on (![]() ), for the node Test_Node_11
all messages are turned off (
), for the node Test_Node_11
all messages are turned off (![]() ) and for the node Gateway some
messages are turned on and some are turned off (
) and for the node Gateway some
messages are turned on and some are turned off (![]() ).
).
If we expand the nodes then we can see the following:
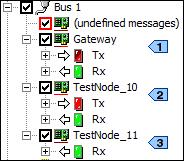
Figure 39: Node icon depending on filter rules of the assigned Tx messages (2)
Here, the nodes are expanded, but the group
items are collapsed. From the node icons or the Tx group icons we can conclude the
same information as before and we can already see why the node Test_Node_11
has the icon ![]() .
It is because the node doesn’t have any assigned Tx messages at all.
.
It is because the node doesn’t have any assigned Tx messages at all.
If we expand the Tx group items then we can see the assigned Tx messages:
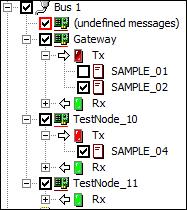
Figure 40: Node icon depending on filter rules of the assigned Tx messages (3)
Now, it becomes clear that for node Gateway
one Tx message is turned on and one is turned off, therefore the node has the
icon ![]() and
the Tx group item has the icon
and
the Tx group item has the icon ![]() . The node TestNode_10 has all its
assigned Tx messages turned on (it is actually just one message), therefore it has
the icon
. The node TestNode_10 has all its
assigned Tx messages turned on (it is actually just one message), therefore it has
the icon ![]() and the Tx
group item has the icon
and the Tx
group item has the icon ![]() .
.
4.3.1.5 Advanced visualization hint (message icons)
Apart from the colour that determines whether a message is a Tx-message or a Rx-message, the message icon exists in two variations (note the existence of a check mark inside the icon):
• ![]() ,
, ![]() - the corresponding message hasn’t been
received yet (there is no occurrence in the Trace Window).
- the corresponding message hasn’t been
received yet (there is no occurrence in the Trace Window).
• ![]() ,
, ![]() - the corresponding message has been
received at least once (there is at least one occurrence in the Trace Window).
- the corresponding message has been
received at least once (there is at least one occurrence in the Trace Window).
4.3.1.6 Context menu for tree items
A context menu can be opened by a right mouse click upon a tree item.
The contents of the context menu depends on the tree item type (bus, node, group or message item).
Context menu for bus items:

Figure 41: Context menu for bus items
Explanation of the menu commands:
• Enable all nodes and messages: turns on all filter rules for the child items (nodes and messages) for that bus, i.e. sets all checkmarks in the checkboxes. (*)
• Disable all nodes and messages: turns off all filter rules for the child items (nodes and messages) for that bus, i.e. clears all checkmarks in the checkboxes. (*)
• Set text color (all items) …: displays the standard Windows Colour Picker dialog to select a colour. The selected colour will be applied as text colour for all tree items (bus, nodes and messages) for that bus.
• Set background color (all items) …: displays the standard Windows Colour Picker dialog to select a colour. The selected colour will be applied as background colour for all tree items (bus, nodes and messages) for that bus.
• Reset colors to system default (all items): resets the text colour and background colour of all tree items to the system default settings.
(*) The commands Enable all nodes and messages and Disable all nodes and messages set/clear the filter rules of the child items, but leave the filter rule of the selected item untouched. In contrast, setting/clearing the checkbox of the selected item leaves the filter rules of the child items untouched. Both actions (setting/clearing the filter rules of the selected item AND all child items) can be combined in one step by clicking the checkbox of the selected item while pressing the <Shift>-key.
Context menu for ordinary node items:

Figure 42: Context menu for ordinary node items
Explanation of the menu commands:
• Enable all Tx messages: turns on the filter rules of all assigned Tx-messages for that node, i.e. sets all checkmarks in the checkboxes. (*)
• Disable all Tx messages: turns off the filter rules of all assigned Tx-messages for that node, i.e. clears all checkmarks in the checkboxes. (*)
• Set text color (this node and all Tx messages) …: displays the standard Windows Colour Picker dialog to select a colour. The selected colour will be applied as text colour for the node item and all assigned Tx-messages for that node.
• Set background color (this node and all Tx messages) …: displays the standard Windows Colour Picker dialog to select a colour. The selected colour will be applied as background colour for the node item and all assigned Tx-messages for that node.
• Apply bus colors to this node and all Tx messages: the text colour and background colour of the parent bus item will be applied to the node item and all assigned Tx-messages.
• Reset colors to system default (this node and all Tx messages): resets the text colour and background colour of the node item and all assigned Tx-messages to the system default settings.
(*) The commands Enable all Tx messages and Disable all Tx messages set/clear the filter rules of the child items, but leave the filter rule of the selected item untouched. In contrast, setting/clearing the checkbox of the selected item leaves the filter rules of the child items untouched. Both actions (setting/clearing the filter rules of the selected item AND all child items) can be combined in one step by clicking the checkbox of the selected item while pressing the <Shift>-key.
Context menu for the special node “(undefined messages)”:

Figure 43: Context menu for the node “(undefined messages)”
Explanation of the menu commands:
• Remove all unreferenced messages: As described in the previous chapters undefined messages are added to the tree dynamically, either due to “real reception” or by importing log files. Those messages are not removed automatically from the tree when the Trace Window (the message list) is cleared. This allows e.g. a fine tuning when importing log files (import once without filtering, then setting appropriate filter rules, then import again). The unreferenced messages are removed from the tree when the stack and/or database configuration is changed, but it is also possible to remove them manually using this menu command. Note: Only messages that are not contained in the message list will be removed from the tree (in the above screenshot the message $6B4 will remain in the tree, because it is contained in the message list).
• Enable all undefined messages: turns on the filter rules of all undefined messages, i.e. sets all checkmarks in the checkboxes. (*)
• Disable all undefined messages: turns off the filter rules of all undefined messages, i.e. clears all checkmarks in the checkboxes. (*)
• Set text color …: displays the standard Windows Colour Picker dialog to select a colour. The selected colour will be applied as text colour for the special node item and all undefined messages.
• Set background color …: displays the standard Windows Colour Picker dialog to select a colour. The selected colour will be applied as background colour for the special node item and all undefined messages.
• Apply bus colors: the text colour and background colour of the parent bus item will be applied to the special node item and all undefined messages.
• Reset colors to system default: resets the text colour and background colour of the special node item and all undefined messages to the system default settings.
(*) The commands Enable all undefined messages and Disable all undefined messages set/clear the filter rules of the child items, but leave the filter rule of the selected item untouched. In contrast, setting/clearing the checkbox of the selected item leaves the filter rules of the child items untouched. Both actions (setting/clearing the filter rules of the selected item AND all child items) can be combined in one step by clicking the checkbox of the selected item while pressing the <Shift>-key.
Context menu for Tx group items:

Figure 44: Context menu for Tx group items
Explanation of the menu commands:
• Enable all Tx messages: turns on the filter rules of all assigned Tx-messages for the parent node, i.e. sets all checkmarks in the checkboxes.
• Disable all Tx messages: turns off the filter rules of all assigned Tx-messages for the parent node, i.e. clears all checkmarks in the checkboxes.
• Set text color (all Tx messages) …: displays the standard Windows Colour Picker dialog to select a colour. The selected colour will be applied as text colour for all assigned Tx-messages of the parent node.
• Set background color (all Tx messages) …: displays the standard Windows Colour Picker dialog to select a colour. The selected colour will be applied as background colour for all assigned Tx-messages of the parent node.
• Apply node colors to all Tx messages: the text colour and background colour of the parent node will be applied to all assigned Tx-messages.
• Reset colors to system default (all Tx messages): resets the text colour and background colour of all assigned Tx-messages of the parent node to the system default settings.
Context menu for Rx group items:
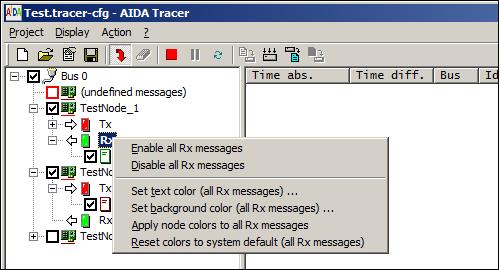
Figure 45: Context menu for Rx group items
Explanation of the menu commands:
• Enable all Rx messages: turns on the filter rules of all assigned Rx-messages for the parent node, i.e. sets all checkmarks in the checkboxes.
• Disable all Rx messages: turns off the filter rules of all assigned Rx-messages for the parent node, i.e. clears all checkmarks in the checkboxes.
• Set text color (all Rx messages) …: displays the standard Windows Colour Picker dialog to select a colour. The selected colour will be applied as text colour for all assigned Rx-messages of the parent node.
• Set background color (all Rx messages) …: displays the standard Windows Colour Picker dialog to select a colour. The selected colour will be applied as background colour for all assigned Rx-messages of the parent node.
• Apply node colors to all Rx messages: the text colour and background colour of the parent node will be applied to all assigned Rx-messages.
• Reset colors to system default (all Rx messages): resets the text colour and background colour of all assigned Rx-messages of the parent node to the system default settings.
The context menu for message items depends on the current view mode (see View modes), but it doesn’t depend on whether the selected message is assigned as Tx-message or as Rx-message.
Context menu
for message items in the Scroll Mode (![]() ):
):

Figure 46: Context menu for message items (Scroll mode)
Explanation of the menu commands:
• Set text color …: displays the standard Windows Colour Picker dialog to select a colour. The selected colour will be applied as text colour for the message at all instances in the tree (a message can be assigned as Tx-message to a node and as Rx-message to several nodes!).
• Set background color …: displays the standard Windows Colour Picker dialog to select a colour. The selected colour will be applied as background colour for the message at all instances in the tree (a message can be assigned as Tx-message to a node and as Rx-message to several nodes!).
• Apply node colors: the text colour and background colour of the parent node will be applied to the message at all instances in the tree (a message can be assigned as Tx-message to a node and as Rx-message to several nodes!).
• Reset colors to system default: resets the text colour and background colour of the message to the system default settings at all instances in the tree (a message can be assigned as Tx-message to a node and as Rx-message to several nodes!).
• Find first occurrence in the
list: this menu command selects the first occurrence of the message in the
Trace Window (message list).
This command also can be invoked without the context
menu by pressing <Ctrl+Shift+F6>.
• Find occurrence in the list
(search backwards): this menu command searches and selects the previous
occurrence of the message relative to the current selection in the Trace Window
(message list). If nothing is currently selected in the message list then it
searches from the end of the list in backwards direction.
This command also can be invoked without the context
menu by pressing <Shift+F6>.
• Find occurrence in the list
(search forward): this menu command searches and selects the next
occurrence of the message relative to the current selection in the Trace Window
(message list). If nothing is currently selected in the message list then it
searches from the beginning of the list in forward direction.
This command also can be invoked without the context
menu by pressing <F6>.
• Find
last occurrence in the list: this menu command selects the last occurrence
of the message in the Trace Window (message list).
This command also can be invoked without the context
menu by pressing <Ctrl+F6>.
• Select message definition in
the tree (find previous): this menu command selects the previous instance
(= in upwards direction) of the same message in the tree window. If the message
is the uppermost instance then it selects the lowermost.
This command also can be invoked without the context
menu by pressing <Shift+F4>.
• Select message definition in
the tree (find next): this menu command selects the next instance (= in
downwards direction) of the same message in the tree window. If the message is
the lowermost instance then it selects the uppermost.
This command also can be invoked without the context
menu by pressing <F4>.
The following screenshot shows an example for the last two commands:

Figure 47: Iteration over all message instances in the tree window
Context menu
for message items in the Fixed Position Mode (![]() ):
):
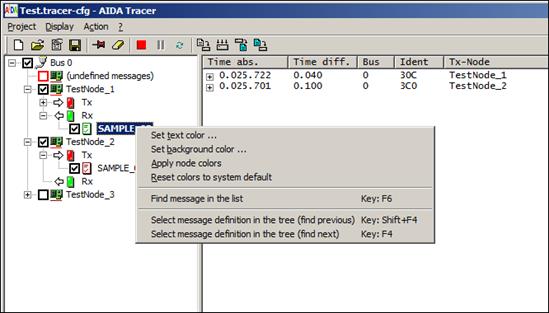
Figure 48: Context menu for message items (Fixed Position mode)
Explanation of the menu commands:
• Set text color …: same as in scroll mode.
• Set background color …: same as in scroll mode.
• Apply node colors: same as in scroll mode.
• Reset colors to system default: same as in scroll mode.
• Find
message in the list: this menu command selects the message in the Trace Window
(message list).
This command also can be invoked without the context
menu by pressing <F6>.
• Select message definition in the tree (find previous): same as in scroll mode.
• Select message definition in the tree (find next): same as in scroll mode.
4.3.2 Trace Window (Message list)
4.3.2.1 View modes
The trace window (right view), also called message list, can be toggled per Display – Scroll view between scroll view - where the messages are sorted in chronological order by reception time - and fixed position view, where each existing message is displayed at a fixed position and its data is updated continuously.
Scroll view (note the ![]() icon in the toolbar):
icon in the toolbar):

Figure 49: CAN Message List – Scroll Mode
Fixed position view (note the ![]() icon in the
toolbar):
icon in the
toolbar):

Figure 50: CAN Message List – Fixed Position Mode
Depending on the information that is
contained in the database (DBC file), messages may contain “signal”
information. In this case, the box with the ‘+’ sign (![]() ) in the left-most column (“Time
abs.”) indicates that the message can be expanded to show the signal
information.
) in the left-most column (“Time
abs.”) indicates that the message can be expanded to show the signal
information.
In the Fixed Position Mode the messages can
be expanded at any time, in the Scroll Mode this is possible only when the
trace is stopped (![]() ) or paused (
) or paused (![]() ).
).
When a message is expanded then the contained signals are shown just below the message with a small indentation.
Additionally, a tooltip with the signal information appears when the mouse hovers over the signal name.
Here is an example screenshot that contains expanded messages in the Fixed Position Mode:
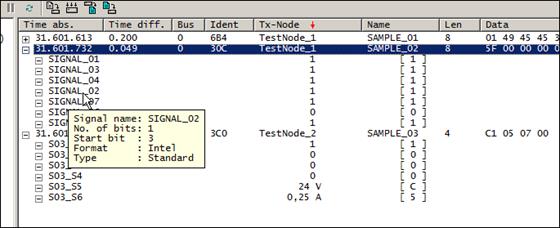
Figure 51: CAN Message List – Expanded messages
For each signal the name is shown, the signal value (logical) and the raw value.
The logical value is derived from the DBC file and may contain a conversion formula and a unit as can be seen in the example screenshot for the signals S03_S5 and S03_S6 of message SAMPLE_03. The value itself is displayed in decimal or float.
The raw value is displayed in square brackets and is always displayed in hexadecimal or float.
AIDA Tracer supports the display of signals in “multiplexed” messages. The following screenshot is an example for the visualisation of a multiplexed CAN Message “SAMPLE_01”.

Figure 52: CAN Message List – Example of a Multiplexed Message
![]() This is the data multiplexor
(“TEST_01_MUX”). The current value is 0.
This is the data multiplexor
(“TEST_01_MUX”). The current value is 0.
![]() The message must be interpreted
in that manner, that the received data is assigned to the multiplex value of 0.
These signals are marked with a greyed minus sign (“TEST_3”, “TEST_2” etc.).
The message must be interpreted
in that manner, that the received data is assigned to the multiplex value of 0.
These signals are marked with a greyed minus sign (“TEST_3”, “TEST_2” etc.).
![]() These signals are assigned to a
multiplexor value which is unequal to 0. The displayed data with the “normal”
(white) minus sign are values which were received in the past.
These signals are assigned to a
multiplexor value which is unequal to 0. The displayed data with the “normal”
(white) minus sign are values which were received in the past.
4.3.2.2 Column configuration
Available columns
The first column of the message list will always show the absolute time. All other columns are customizable with respect to the size, the order and the visibility.
Apart from the absolute time the following columns can be displayed:
• Time difference
• Bus number (“Bus”)
• Message identification (“Ident”)
• Transmission node (“Tx-Node”)
• Message name (“Name”)
• Message length (number of bytes)
• Message data (hexadecimal byte array)
• Message data (ASCII representation)
• Message count (number of received messages)
Configuration of column width
The size of a column can be changed similarly
as in the Windows Explorer: Hover the mouse over the border line between two
column headers until the mouse cursor turns into a double arrow with vertical
line (![]() ),
then click and hold the left mouse button and drag the column border to the
left or right to adjust the width.
),
then click and hold the left mouse button and drag the column border to the
left or right to adjust the width.
The column sizes are stored in the tracer configuration files (*.tracer-cfg).
Configuration of column order
The column order can be changed by click and hold onto a column header in the middle, then dragging it to the left or right (similar as in the Windows Explorer).
The column order is stored in the Windows Registry as global setting for the AIDA Tracer.
Configuration of column visibility
The visibility can be changed in the context menu for the column headers. The context menu appears after a right mouse click on any of the column headers:

Figure 53: CAN Message List – Column configuration
The context menu also contains two entries to display all columns and to restore the column default order.
The visibility status of the columns is stored in the Windows Registry as global setting for the AIDA Tracer.
Signal columns
The previous description of columns refers to the rows that contain messages. When messages are expanded then additional rows for the contained signals are displayed. As mentioned before, the rows for the signals contain 3 columns.
The width and the horizontal position of those signal columns can be adjusted with additional column headers, but they are not displayed by default. They can be displayed when a row with a signal is selected and then the <Shift>-key is pressed and held:
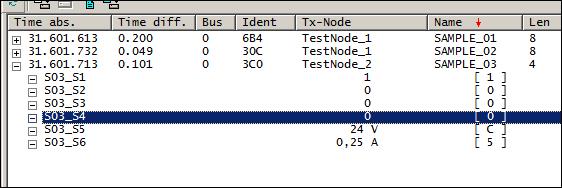
Figure 54: CAN Message List – Selection of a signal row
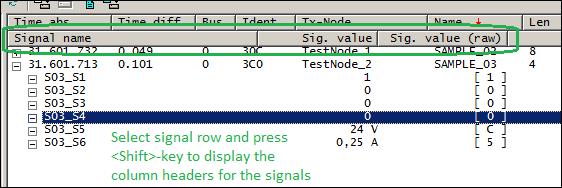
Figure 55: CAN Message List – Selection of a signal row with pressed <Shift>-key
With these column headers the size and (implicitly) the position of the signal columns can be adjusted. The procedure is similar as with the width adjustment of the message columns, but additionally the <Shift>-key must be held.
The column headers for the signals will disappear as soon as the <Shift>-key is released.
4.3.2.3 Message sort order
In the Scroll Mode (![]() ) the messages are listed as they
appear, i.e. in chronological order.
) the messages are listed as they
appear, i.e. in chronological order.
The Fixed Position
Mode (![]() )
allows sorting by:
)
allows sorting by:
• Bus number (“Bus”)
• Message identification (“Ident”)
• Transmission node (“Tx-Node”)
• Message name (“Name”)
in ascending and descending order.
The sort column and sort order can be changed by clicking on the corresponding column header.
The column that is used for the sorting and
the sort direction is indicated by a red arrow in the column header, “![]() ” for ascending
and “
” for ascending
and “![]() ” for
descending order.
” for
descending order.
Examples:

Figure 56: CAN Message List – Sort by bus number (ascending)
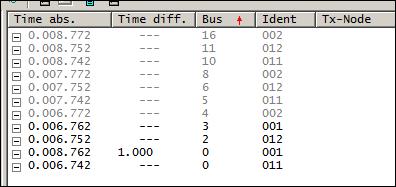
Figure 57: CAN Message List – Sort by bus number (descending)
The sort column and sort direction are stored in the tracer configuration files (*.tracer-cfg).
4.3.2.4 Navigation in the message list
In the Scroll view (![]() ), when the tracing is started (
), when the tracing is started (![]() ) and no message
is selected, the AIDA Tracer jumps to the end of the list whenever a message is
received (automatic scrolling). This ensures that all new messages can be seen
immediately. This means on the other hand that older messages will soon go out
of the visible area of the message list.
) and no message
is selected, the AIDA Tracer jumps to the end of the list whenever a message is
received (automatic scrolling). This ensures that all new messages can be seen
immediately. This means on the other hand that older messages will soon go out
of the visible area of the message list.
The automatic scrolling stops as soon as a message is selected with the mouse. Yet, new messages are still appended at the end of the list.
The automatic scrolling resumes as soon as the message is “unselected”. This can be done either by pressing the “ESC”-key or by clicking with the mouse in an unused area of the message list right to the rightmost column.
When a message is selected it is possible to jump to the beginning of the list by pressing the “Home”-key and to the end of list by pressing the “End”-key.
4.3.2.5 Context menu for list items
A context menu can be opened by a right mouse click upon a message item.
The context menu for message items depends on the current view mode.
Context menu
for message items in the Scroll Mode (![]() ):
):

Figure 58: Context menu in the Trace Window (Scroll mode)
Explanation of the menu commands:
• Find
first message (same Bus and Ident): this menu command selects the first
occurrence of the same message.
This command also can be invoked without the context
menu by pressing <Ctrl+Shift+F4>.
• Find
previous message (same Bus and Ident): this menu command searches and
selects the previous occurrence of the same message. (In the screenshot this is
the yellow message above the currently
selected message.)
This command also can be invoked without the context
menu by pressing <Shift+F4>.
• Find
next message (same Bus and Ident): this menu command searches and selects
the next occurrence of the same message. (In the screenshot this is the yellow message below the currently selected
message.)
This command also can be invoked without the context
menu by pressing <F4>.
• Find
last message (same Bus and Ident): this menu command selects the last
occurrence of the same message.
This command also can be invoked without the context
menu by pressing <Ctrl+F4>.
• Find
previous message (same Bus and Tx-Node): this menu command searches and
selects the previous occurrence of a message that is transmitted by the same
node. (In the screenshot this is the purple
message above the currently selected message.)
This command also can be invoked without the context
menu by pressing <Shift+F5>.
• Find next message (same Bus
and Tx-Node): this menu command searches and selects the next occurrence of
a message that is transmitted by the same node. (In the screenshot this is the green message below the currently selected
message.)
This command also can be invoked without the context
menu by pressing <F5>.
• Select
message definition in the tree (at Tx-Node): this menu command selects the
message in the tree window (the message instance that is assigned to the transmitting
node).
This command also can be invoked without the context
menu by pressing <F6>.
Context menu
for message items in the Fixed Position Mode (![]() ):
):

Figure 59: Context menu in the Trace Window (Fixed Position mode)
Explanation of the menu commands:
• Find previous message (same Bus and Tx-Node): same as in scroll mode. (In the screenshot this is the yellow message above the currently selected message.)
• Find next message (same Bus and Tx-Node): same as in scroll mode. (In the screenshot this is the purple message below the currently selected message.)
• Select message definition in the tree (at Tx-Node): same as in scroll mode.
5 Installation
All necessary files to run the program are part of the AIDA installing process.
Hint: For configuration and use of the communication stacks, the AIDA_Stacker.exe, the stack components *.component and eventually additional hardware driver(s) (e.g. CAN driver from Vector GmbH) are required.